使用 InfluxDB 和 AWS 构建物联网数据管道
作者:Jason Myers / 用例, 产品
2023 年 6 月 26 日
导航至
本文最初发表于 The New Stack,并经许可在此处转载。
可靠的数据管道对于工业至关重要,它提供关于机器状态的关键信息,并用于训练预测模型以改进运营。
物联网 (IoT) 和运营技术 (OT) 领域充斥着时序数据。传感器以稳定且大量的速度产生带有时间戳的数据,而处理所有这些数据可能是一个挑战。但是,您不希望收集一堆数据只是放在那里,占用存储空间而不提供任何价值。
因此,为了从物联网/OT 数据中获得价值,让我们看看如何使用 InfluxDB 和 Amazon Web Services (AWS) 配置传感器,以收集由 工业 设备生成的时序数据类型。您可以调整、扩展和缩放这里的概念,以满足全面的工业生产需求。以下是我们在示例中将使用的内容以及原因。
- InfluxDB: 这个时序数据库刚刚发布了一个更新版本,该版本在几个关键领域优于以前的版本,例如针对高基数数据的查询性能、压缩和数据摄取。对于本示例至关重要的是,InfluxDB 的云产品 在 AWS 中可用。在许多情况下,将所有内容放在同一个地方可以减少数据传输和数据延迟问题。
- Telegraf: Telegraf 是一个开源的、基于插件的数据收集代理。Telegraf 轻量级且用 Go 编写,您可以将其部署在任何地方。Telegraf 拥有 300 多个可用插件,可以从任何来源收集数据。您还可以编写自定义插件,从任何尚无插件的来源收集数据。
- AWS: Amazon Web Services 拥有一整套面向 IoT 的工具和服务。我们可以利用其中的一些服务来简化数据处理和分析。
- M5stickC+: 这是一款简单的物联网设备,可以检测一系列测量值,包括位置、加速度指标、陀螺仪指标、湿度、温度和压力。该设备提供多个数据流,这与工业运营商在制造设备方面面临的情况类似。
InfluxDB 和 AWS IoT 实践
以下示例说明了许多可能的数据管道之一,您可以对其进行扩展以满足各种工业设备的需求。这可能包括工厂车间的机器或现场的分布式设备。让我们从快速概述开始;然后我们将深入探讨细节。
基本数据流是
设备 → AWS IoT Core → MQTT (规则/路由) → Kinesis → Telegraf → InfluxDB → 可视化
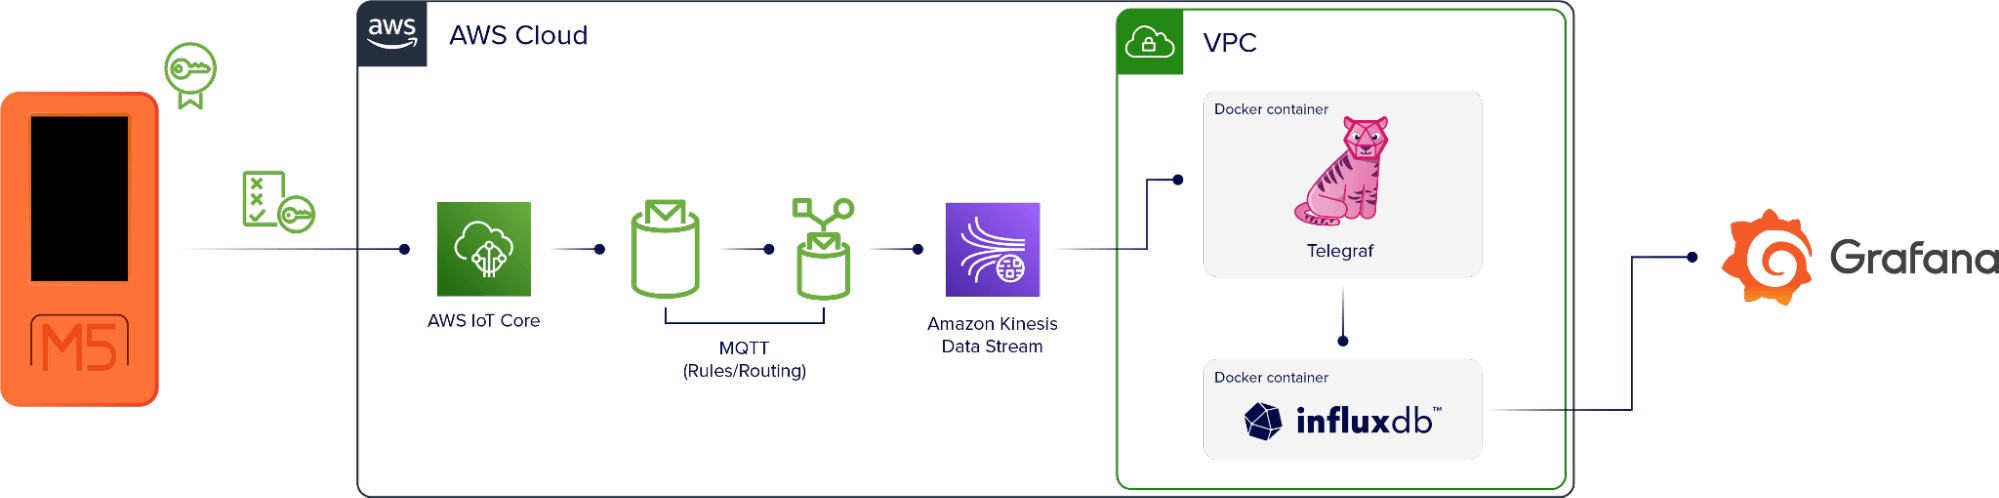
M5stickC+ 设备设置为直接使用 AWS 进行身份验证。数据进入 AWS IoT Core,这是一个 AWS 服务,它使用 MQTT 将数据添加到特定于设备的主题。然后有一个规则,选择通过主题的所有数据,并将其重定向到监控工具 Amazon Kinesis。
在 AWS 中运行的虚拟机也运行两个 Docker 容器。一个包含 Telegraf 实例,另一个包含 InfluxDB 实例。Telegraf 从 Kinesis 收集数据流并将其写入 InfluxDB。Telegraf 还使用 DynamoDB 表作为此设置中的检查点,因此如果容器或实例关闭,它将在应用程序再次启动时从数据流中的正确点重新启动。
一旦数据进入 InfluxDB,我们就可以使用它来创建可视化效果。
好的,这就是基本的数据管道。现在,我们如何使其工作?
设备固件
第一步是创建从 M5 设备到 AWS 的数据连接。为了实现这一点,我们使用 UI Flow,这是一个拖放编辑器,它是 M5 堆栈的一部分。查看下图中的块,以了解设备正在收集的内容以及这些内容如何映射到我们最终的输出。
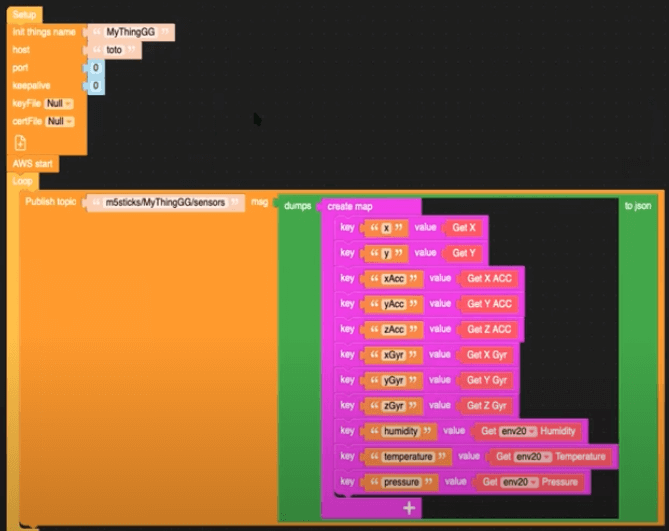
我们可以在这里看到,此数据发布到 MQTT 主题 m5sticks/MyThingGG/sensors。
AWS IoT Core 规则
随着设备数据发布到 MQTT 代理,接下来我们需要在 AWS IoT Core 中订阅该主题。在主题过滤器字段中,输入 m5sticks/+/sensors 以确保来自设备的所有数据最终都进入 MQTT 主题。
接下来,我们需要创建另一个规则,以确保 MQTT 主题中的数据进入 Kinesis。在 IoT Core 中,您可以使用 SQL 查询来完成此操作
SELECT *, topic(2) as thing, 'sensors' as measurement, timestamp() as timestamp FROM 'm5sticks/+/sensors'在工业环境中,每个设备都应该有一个唯一的名称。因此,为了扩展此数据管道以适应多个设备,我们在 MQTT 主题中使用 + 通配符,以确保来自所有设备的所有数据都最终进入正确的位置。
此查询向数据添加时间戳,使其符合 line protocol,InfluxDB 的数据模型。
Telegraf 策略
现在数据正在从设备流向 Kinesis,我们需要将其放入 InfluxDB 中。为此,我们使用 Telegraf。以下代码是确定 Telegraf 如何与 Kinesis 交互的策略。它使 Telegraf 能够从 Kinesis 流中读取数据,并启用对 DynamoDB 的读写访问以进行检查点操作。
{
 "Version": "2012-10-17"
 "Statement": [
 {
 "Sid": "AllowReadFromKinesis",
 "Effect": "Allow",
 "Action": [
 "kinesis:GetShardIterator",
 "kinesis:GetRecords",
 "kinesis:DescribeStream"
 ],
 "Resource": [
 "arn:aws:kinesis:eu-west-3:xxxxxxxxx:stream/InfluxDBStream"
 ]
 },
 {
 "Sid": "AllowReadAndWriteDynamoDB",
 "Effect": "Allow",
 "Action": [
 "dynamodb:PutItem",
 "dynamodb:GetItem"
 ],
 "Resource": [
 "arn:aws:kinesis:eu-west-3:xxxxxxxxx:table/influx-db-telegraf"
 ]
 }
 ]
}
Telegraf 配置
以下 Telegraf 配置使用 Docker 容器网络、Telegraf Kinesis Consumer 插件 从 Kinesis 读取数据,以及 InfluxDB v2 输出插件 将数据写入 InfluxDB。请注意,字符串字段与设备固件 UI 中的值匹配。
[agent]
debug = true

[[outputs.influxdb_v2]]

## The URLs of the InfluxDB Cluster nodes.
##
## Multiple URLs can be specified for a single cluster, only ONE of the
## urls will be written to each interval.
## urls exp: http://127.0.0.1:8086
urls = ["http://influxdb:8086"]

## Token for authentication.
token = "toto-token"

## Organization is the name of the organization you wish to write to; must exist.
organization = "aws"

## Destination bucket to write into.
bucket = "toto-bucket"

[[inputs.kinesis_consumer]]
## Amazon REGION of kinesis endpoint.
region = "eu-west-3"

## Amazon Credentials
## Credentials are loaded in the following order
## 1) Web identity provider credentials via STS if role_arn and web_identity_token_file are specified
## 2) Assumed credentials via STS if role_arn is specified
## 3) explicit credentials from 'access_key' and 'secret_key'
## 4) shared profile from 'profile'
## 5) environment variables
## 6) shared credentials file
## 7) EC2 Instance Profile

## Endpoint to make request against, the correct endpoint is automatically
## determined and this option should only be set if you wish to override the
## default.
##   ex: endpoint_url = "https://:8000"
# endpoint_url = ""

## Kinesis StreamName must exist prior to starting telegraf.
streamname = "InfluxDBStream"

## Shard iterator type (only 'TRIM_HORIZON' and 'LATEST' currently supported)
# shard_iterator_type = "TRIM_HORIZON"

## Max undelivered messages
## This plugin uses tracking metrics, which ensure messages are read to
## outputs before acknowledging them to the original broker to ensure data
## is not lost. This option sets the maximum messages to read from the
## broker that have not been written by an output.
##
## This value needs to be picked with awareness of the agent's
## metric_batch_size value as well. Setting max undelivered messages too high
## can result in a constant stream of data batches to the output. While
## setting it too low may never flush the broker's messages.
# max_undelivered_messages = 1000

## Data format to consume.
## Each data format has its own unique set of configuration options, read
## more about them here:
## https://github.com/influxdata/telegraf/blob/master/docs/DATA_FORMATS_INPUT.md
data_format = "json"

## Tag keys is an array of keys that should be added as tags.
tag_keys = [
 "thing"
]

## String fields is an array of keys that should be added as string fields.
json_string_fields = [
 "pressure",
 "xGyr",
 "yAcc",
 "batteryPower",
 "xAcc",
 "temperature",
 "zAcc",
 "zGyr",
 "y",
 "x",
 "yGry",
 "humidity"

]

## Name key is the key used as the measurement name.
json_name_key = "measurement"

## Time key is the key containing the time that should be used to create the
## metric.
json_time_key "timestamp"

## Time format is the time layout that should be used to interpret the
## json_time_key. The time must be 'unix', 'unix_ms' or a time in the
## "reference_time".
##   ex: json_time_format = "Mon Jan 2 15:04:05 -0700 MST 2006"
##       json_time_format = "2006-01-02T15:04:05Z07:00"
##       json_time_format = "unix"
##       json_time_format = "unix_ms"
json_time_format = "unix_ms"

## Optional
## Configuration for a dynamodb checkpoint
[inputs.kinesis_consumer.checkpoint_dynamodb]
## unique name for this consumer
app_name = "default"
table_name = "influx-db-telegraf"
Docker Compose
此 Docker compose 文件使用 SSH 上传到 EC2 实例。
version: '3'

services:
  influxdb:
    image: influxdb:2.0.6
    volumes:
      # Mount for influxdb data directory and configuration
      - influxdbv2:/root/.influxdbv2
    ports:
      - "8086:8086"
# Use the influx cli to set up an influxdb instance
  influxdb_cli:
    links:
      - influxdb
    image: influxdb:2.0.6
# Use these same configurations parameters in you telegraf configuration, mytelegraf.conf
 # Wait for the influxd service in the influxdb has been fully bootstrapped before trying to set up an influxdb
   restart: on-failure:10
   depends_on:
   - influxdb
  telegraf:
    image: telegraf:1.25-alpine
    links:
      - influxdb
    volumes:
      # Mount for telegraf config
      - ./telegraf.conf:/etc/telegraf/telegraf.conf
    depends_on:
      - influxdb_cli

volumes:
  influxdbv2:
可视化
一旦您的数据进入 InfluxDB,运行 InfluxDB 的用户就可以使用您选择的工具创建可视化效果和仪表板。InfluxDB 提供与 Grafana 的原生集成,并支持使用 Flight SQL 兼容工具的 SQL 查询。
结论
构建可靠的数据管道是工业运营的关键方面。此数据提供关于机器和设备当前状态的关键信息,并且可以训练用于改进机器操作和效率的预测模型。将 InfluxDB 和 AWS 等领先技术相结合,提供了捕获、存储、分析和可视化此关键过程数据所需的工具。
此处描述的用例只是构建数据管道的一种方式。您可以更新、扩展和修改它以适应各种工业物联网/OT 操作,或者使用 InfluxDB 和 AWS 可用的物联网解决方案 系列构建完全自定义的解决方案。
